STEM Concept

Assessment Barriers

Online assessments need to ensure that math equations in students’ responses are accessible to assistive technology (AT) software applications. Students who rely on assistive technology might need to submit assessments in alternate formats. 

 Tests & Quizzes

When a test or quiz is created in an online environment, it is important that all elements are labeled and the directions are clear.

Checkboxes and radio buttons in the response area need to indicate when a selection is checked or not checked.

When open answer fields are provided in online tests, the response area should ensure that screen readers can access what students are entering as they compose their answers, as well as the ability to read back to them the completed entry. When the entry field allows math expressions to be entered, then an accessible math entry technique should be available. The math entry process should allow at least two accessible entry techniques, which may include an accessible navigable math entry palette, the use of easily discoverable keyboard shortcuts, direct braille entry via a refreshable braille display, and/or commonly used qwerty code entry conventions, such as AsciiMath or LaTeX input.   

In the case of traditional “paper and pencil” tests, students with handwriting issues (e.g., dysgraphia, CP, upper mobility impairment) may not be able to legibly write math equations on paper. In such cases, human scribes may need to be provided. Alternatively, the student might need to complete the test using an accessible computer entry method, which may include an onscreen math palette that works with standard or adapted mice (e.g., track ball, head mouse, eye gaze), or speech input enabled math editors like MathTalk  or EquatIO.

 Papers and Lab Reports

While mathematics classes rarely have the equivalent of research papers, some proofs may require extensive literary elaboration along with mathematical formulas. On the other hand, research papers in the sciences are very common and may require the student to create hundreds of math expressions as well as various types of graphs.

Lab reports for physics labs and chemistry are another case where the student will need to create a large number of math expressions. Chemical equations are very similar in the way that linear math expressions are laid out and also require the student to use an editing tool to create chemical formulas.

 Homework

There is an inherent communication problem that arises around the ability of sighted teachers and blind students to use the same formats.

Blind students may be used to doing math on a braille notetaker, but that doesn’t provide the teacher with a format that results in displayed math notation.

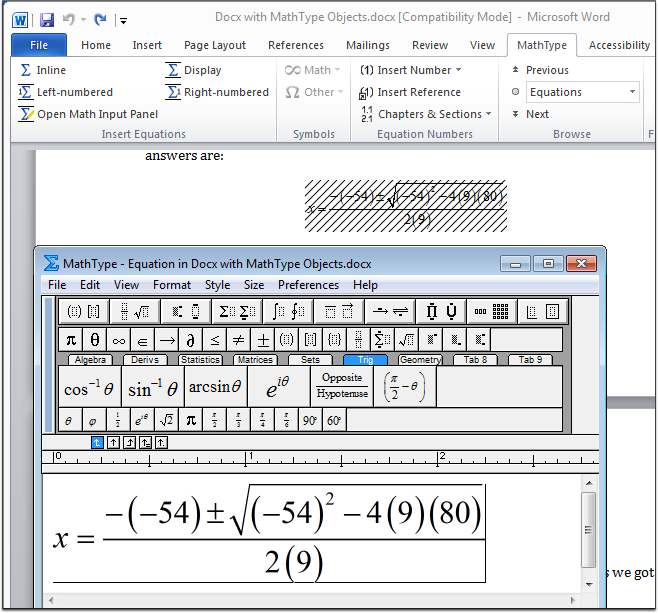
Recommended Software: MathType 

MathType is a software designed to help type and hand-write mathematical notation to include quality math equations in documents and digital content easily. MathType is available for desktop, web (Google Docs), and Microsoft Word on iPad.

Some key features include:

  • Save frequently used equations and symbols in customizable toolbars
  • Setup personal keyboard shortcuts
  • Copy or convert to LaTeX
  • Automatic spacing that conforms to international mathematics typesetting conventions
  • Integrated with Microsoft Word, PowerPoint, and Apple Pages
  • Edit all formulas created with Microsoft Equation 3.0, as well as Microsoft’s OMML equation editor
  • Export and import MathML, making it easy to integrate into many publishing workflows using XML
  • Save or export equations as images for applications that support only images
  • Choose font, color, and size according to your preferences or style guide
  • Use any standard keyboard input method to input non-Latin based characters & accepts international keyboards
  • Directly integrates with Word and Duxbury Braille Translator (DBT) to create documents with mathematical braille

Additional MathType Resources: 

MathPlayer

When creating math expressions in MathType with Microsoft Word or PowerPoint, MathPlayer will allow you to immediately hear how a math expression will be read without having to use a screen reader. This is especially useful when someone is just beginning to use MathType, because there may be more than one way of authoring a math expression which may look right visually, but not necessarily convey the same semantics and thus produce different speech. MathPlayer is also needed if you are going to try to read the Word or PowerPoint document later with the NVDA screen reader. MathPlayer also provides for speech output when MathType has been used to export an HTML document containing MathML expressions.

One thing to note is that although MathPlayer runs in either the 64-bit or 32-bit Windows Operating System, it does not support the 64-bit version of Word. There are only a few instances where users will have the 64-bit version of Office installed on their PC (the 32-bit version is suggested for most users regardless of what Windows operating system is used), so this is unlikely to be an issue. Nonetheless, MathPlayer is not essential to the math production process and won’t impact the ability to use MathType in cases where the 64-bit version of Office has been installed.

Desmos

desmos logo

 Desmos is an advanced graphing calculator implemented as a web application and a mobile application written in JavaScript.

Graphs can be created ahead of time and embedded directly into Canvas. 

Pandoc

Pandoc logo 

While not needed to author STEM materials in their native formats, Pandoc is a useful application in circumstances where one desires to write content in one format and then export to another end product format. Pandoc is a free-to-use line-command tool that supports accessible math input and output formats including LaTeX, MathML, and MathJax. The strength of Pandoc is that it is very versatile and can be built into a very precise automated conversion process. On the other hand, it has a steep learning curve and will require a significant time investment to perfect the conversion process. It may, however, be a time-saving solution in the long run in some instances – for example, when math faculty create an extensive amount of content using LaTeX.

InftyReader

InftyReader logo

InftyReader is an Optical Character Recognition (OCR) application that recognizes and translates scientific documents (including math symbols) into LaTeX, MathML and XHTML.

WordToEpub

Daisy Consortium logo

Using Microsoft Word and WordToEPUB, you can convert documents to the latest EPUB 3 format. EPUB is a wonderful format for reading publications on laptops, tablets, and smartphones, and it includes features such as rich navigation and great accessibility. The EPUB files created with this tool can be used in a wide variety of reading apps on any platform, with the ability to personalize visual features such as colors, font, text size, and layout. Many reading apps have other useful features such as read aloud, the ability to add comments and bookmarks, and support for electronic braille.

GrindEQ

GrindEQ logo

GrindEQ converts MathType to OML or LaTex to Word (Word equation editor).

This program is ideal for converting equations from MathML to OML equations. This program is best suited for creating EPUB files using WordToEPUB. 

Central Access Reader

CAR logo

Central Access Reader (CAR) is a free, open-source, text-to-speech application designed specifically for students with print-related disabilities. CAR reads Word docs and pasted text using the voice installed on your computer. CAR has an intuitive interface and many customizable features.

 Thorium

Thorium logo

Thorium is an accessible EPUB reader that can interact with math content that has been created from OML objects using the WordToEPUB toolbar.

MathML & the student experience 

Using MathML provides not only equal access to math content for students with disabilities but provides all students access to rich math content with support for enhanced learning delivery modes.

Equations authored in MathML can be displayed onscreen with highlighting that moves in sync with synthetic speech, providing students with multi-modal visual and aural learning support. MathML also provides the capacity to allow students to visually and aurally “walk through” various parts of an extended equation at their own pace. These capabilities will aid all students as they learn math concepts.

MathML, a standardized digital design feature, provides unrestricted comparable access to math for people with – and without – disabilities. Finally, the universal design features of math content authored with MathML will provide enhanced learning benefits to all students.

MathML is intended to facilitate the use and re-use of mathematical and scientific content on the Web and for other applications such as computer algebra systems, print typesetting, and voice synthesis. MathML can be used to encode both the presentation of mathematical notation for high-quality visual display and mathematical content, and for applications where the semantics play more of a key role, such as scientific software or voice synthesis.

Determine when to use the Rich Content Editor

When possible, use the rich content editor for instructional content. 

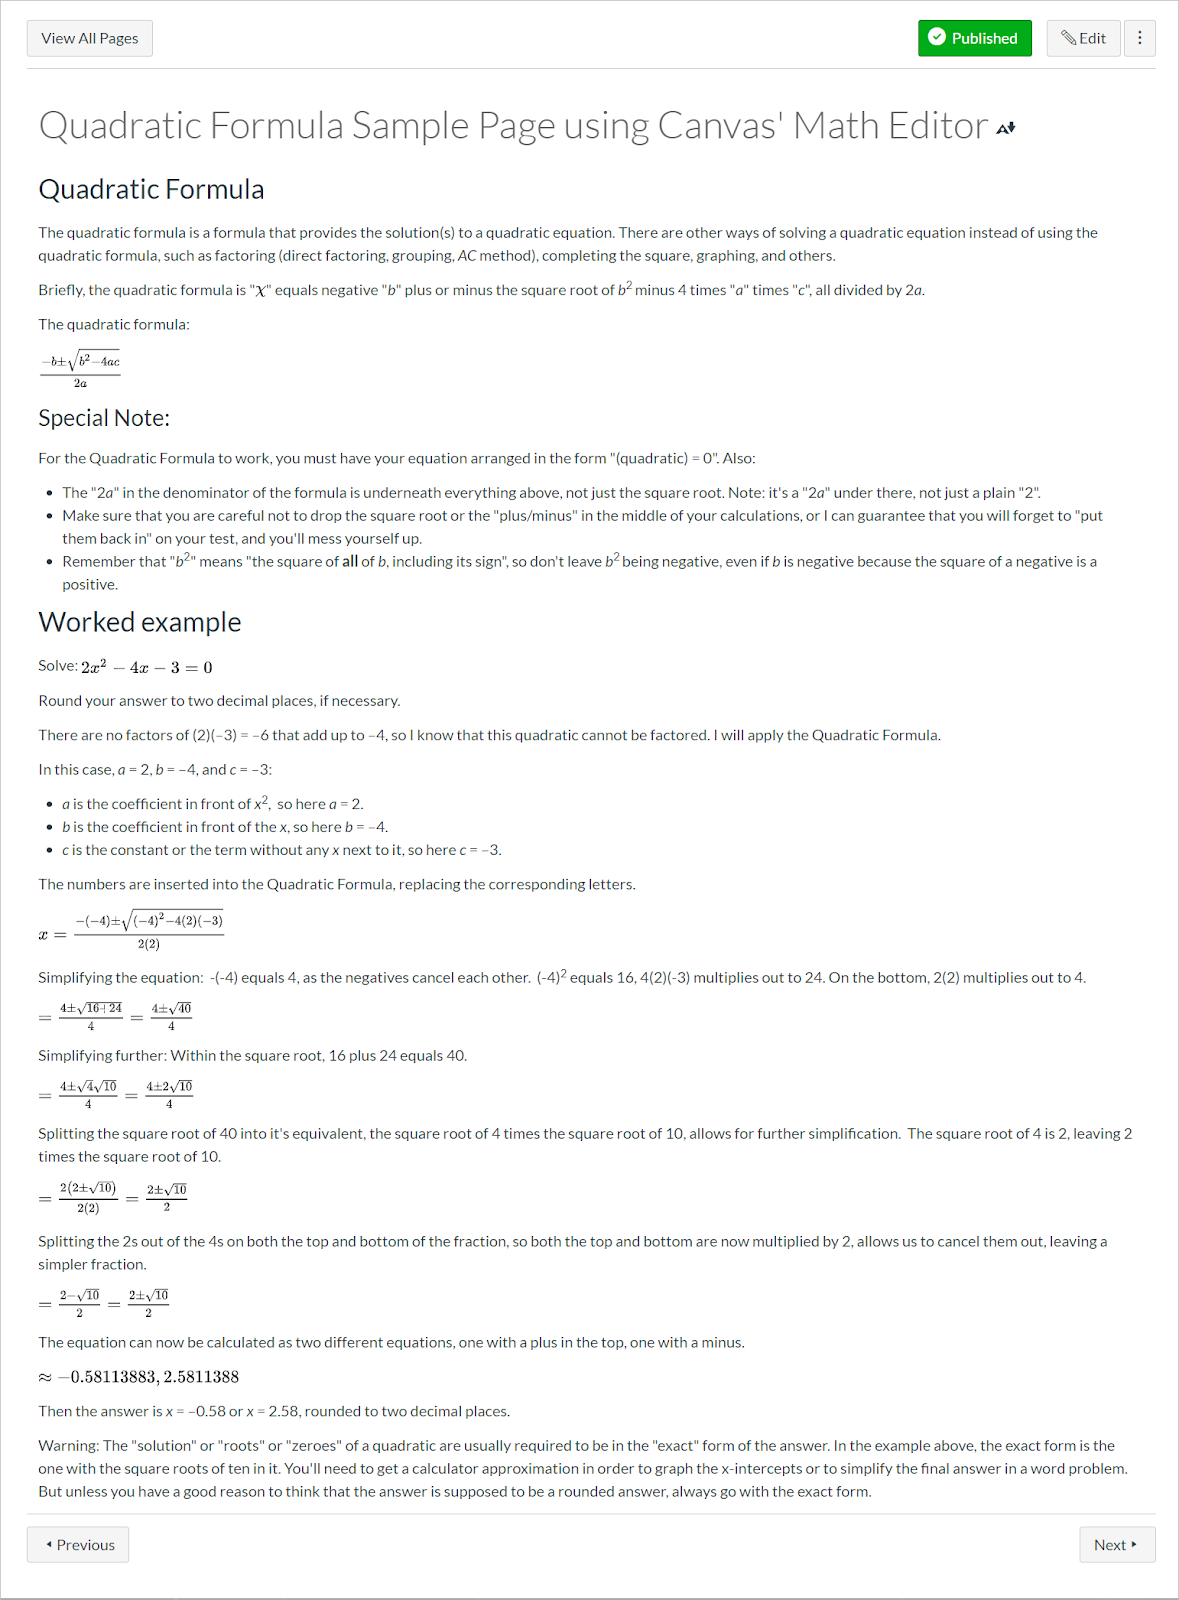
For example, use Canvas math equation editor for instructional content. Instructors should use Canvas’ math editor for instructional lectures and tutorials.

Header usage and organizing the content into shorter portions helps students navigate different aspects of the equation. It is extremely helpful to provide textual descriptions explaining the content and context of equations before and after a math problem. Providing detailed explanations before and after a math problem helps reinforce and summarize important concepts. 

Below is an example of how one would introduce and organize math content on a Canvas page.

Canvas page that provides additional textual description of how to solve a mathematical equation step-by-step.

Use an accessible MS Word doc for problem sets

For large problem sets that require students to interact with equations, create an accessible MS Word document.

Mathematical Content

Microsoft Word documents that contain math equations using the MathType Equation Editor can be converted into other formats while retaining the accessibility functionality of the mathematical content. At this time, MS Word documents must be saved as DOCX and use the MathType Equation Editor to input the math equations. 

Alternatively, you can input equations using LaTeX, but these equations will need to be converted to MathType Equations before the document can be used with assistive technologies or submitted to the SCRIBE platform.

MathType window in Microsoft Word.

Complex Data & Graphs Concept

Complex Images

Complex images contain substantial information – more than can be conveyed in a short phrase or sentence. These are typically:

  • graphs and charts, including flow charts and organizational charts;
  • diagrams and illustrations where the page text relies on the user being able to understand the image;
  • maps showing locations or other information such as weather systems.

In these cases, a two-part text alternative is required. The first part is the short description to identify the image and, where appropriate, indicate the location of the long description. The second part is the long description – a textual representation of the essential information conveyed by the image. The following examples show different approaches that can be used to provide such short and long descriptions.

Accompanying text (Long Description) 

There are situations where the composition of an image is important and needs to be provided in the long description. For example, the sequence of colors used and the relative heights of the columns in a bar chart may be relevant information about the structure of the chart, in addition to the actual values and trends that it depicts.

Remember that complex images can be difficult to understand by many people – in particular people with learning disabilities and people with low vision. Long descriptions benefit many people, and it is good practice to make them available to everyone, for example, as part of the main content. It may also be possible to reduce unnecessary complexity in your images and make them easier to understand for everyone.

It is also good practice to refer to and summarize more complex images from the accompanying text. For example, a reference such as “The following graph shows that visitors were lost in the first quarter, but the numbers recovered in the second quarter” helps to point out the relevant information that the image is intended to present.

Web Accessibility Initiative. (2019, July 27). Complex Images. W3. https://www.w3.org/WAI/tutorials/images/complex/

Example: Description containing structured information

Long description of the pie graph above

Overview

The pie graph shows the various reasons for inaccessibility including in the order of popularity:

  1. Lack of awareness 
  2. Lack of skills/knowledge 
  3. Look/feel/functionality 
  4. Lack of budget/resources

Which of the following do you think is the primary reason that many developers do not create accessible websites?

Values

Numerical values presented on the image:

Response# of Respondents% of Respondents 
Lack of awareness of web accessibility 103143.0%
Lack of web accessibility skills or knowledge63826.6%
Fear that accessibility will hinder the look, feel, or functionality 48720.3%
Lack of budget or resources to make it accessible24210.1%
Response Number and Percentage of Respondents

Presentation

Write text from the image directly on the Canvas page and add pie graphs and charts. See Accessible Version of Reasons for Inaccessibility to review example on a Canvas page.

6 Tips for Creating Accessible Course Content

These seven tips are a starting point for creating accessible course content; for additional information or if questions arise, please contact Aaron Holmes, Access Specialist at aholmes@miracosta.edu

  1. Add a Disability Accommodations statement:

    Please review Page 3 of MiraCosta’s syllabus checklist for examples of recommended language:

    Disability Accommodations
    If you have a disability or medical condition impacting learning and have not yet been authorized to receive academic accommodations, you are encouraged to contact the Student Accessibility Services (SAS) office (formerly known as Disabled Students Programs and Services or DSPS). The SAS office can be reached at (760) 795-6658, or by email at sas@miracosta.edu. The SAS office will help you determine what accommodations are available for you. If you’re requesting my assistance utilizing any authorized accommodations, please contact me as soon as possible.

    OR

    If you have a disability, you are encouraged to contact Student Accessibility Services (SAS) (formerly known as Disabled Students Programs and Services or DSPS) at 760.795.6658. Their Oceanside campus office is located in Building 3000, adjacent to Parking lot 3C. They will help you determine what assistance is available for you.

    OR

    If you have a hidden or visible disability, which may require classroom or test accommodations, please contact me as soon as possible. If you have not already done so, please register with Student Accessibility Services (SAS) (formerly known as Disabled Students Programs and Services or DSPS) at 760.795.6658. Their Oceanside campus office is located in Building 3000, adjacent to parking lot 3C.

  2. Add links to Vendor Accessibility information for specialty products used in your course.

  3. Create instructional content with accessibility in mind. Review and apply the following accessibility principles:
  4. Create accessible instructional content based on application.
  5. Accessibility Checkers: always use the software’s built-in Accessibility Checker (Pope Tech Instructor Accessibility Guide in Canvas, Word, Adobe Acrobat, Excel, PowerPoint, etc.). Follow the Repair recommendations provided by the Accessibility Checker to fix errors.

    Resources: 
  6. Ensure Readability Divide large blocks of text into smaller more manageable sections; avoid complex sentences; use sans-serif font at approximately 12 points. Ensure reading order is correct when screen readers are used (beware text boxes and other non-sequential methods for adding text).

    Resources: Website Readability assessment tool

Structure Concept

Headings & Structure

Take a quick look at the newspapers in the image below. At a quick glance, even with a small image, you can easily ascertain the title of the newspaper, the titles of articles, and the “lead” story. Newspapers are great examples of the ways formatting text can aid readers.

Examples of various newspapers with different for headings.

Headings

Organizing content prevents cognitive overload, providing information in digestible pieces for your students. Headings are valuable in presenting the main points of a section, by providing a logical structure for information, or allowing visitors to skim the contents.

From an accessibility perspective, headings provide individuals using screen readers with a simple method to navigate within a page or a document. A recent WebAIM survey of screen-reader users found that using headings remains the predominant method for finding web page information and that over 80% of respondents found headings very useful or somewhat useful when navigating content. The use of headings allows individuals to move and find information in a more efficient manner.

Heading Styles

Heading 2 is larger than Heading 3. Heading 3 is larger than Heading 4.

Here we see Heading 2, Heading 3, and Heading 4.

Using different heading styles along with changes in the font size can help individuals perceive the content, organize the information into meaningful sections, and understand how the subtopics relate to the main topics, and with one another:

  • Heading 1 is the main topic or title of the content
  • Heading 2 is used for major subtopics that still relate to the main content
  • Heading 3 and Heading 4 (and more) can be used to further refine the related subtopics

If you are consistent in your heading level structure, users can quickly determine based on text size how the major subtopics (e.g., Heading 2 content) relates to their other subtopics (e.g., Heading 3 and Heading 4 content.)

Common Heading Mistakes 

  • Skipping heading levels. For Example: Choosing a Heading 3 for the main title, followed by a Heading 1, and then a Heading 4.
  • Using the font size, bold, and underline features to create the appearance of a heading instead of programmatically specifying a heading element and then modifying the appearance.

Lists

Lists neatly present related ideas and outlines steps in a process. Bulleted and numbered lists can be used in your documents to format, arrange, and emphasize text. For an individual using assistive technology, such as a screen-reader, the benefit of the list format is that the presence and number of items in that list will be communicated when navigating the content.

Bulleted List 

If your items are a group of equivalent ideas or terms, and the order is not an essential aspect of the concept, use a bulleted list. For example, the following is a list of accessibility practices for electronic documents:

  • Organize material into usable sections
  • Use styles to mark headings for present visually organized pages
  • Integrate meaningful hyperlinks into your text
  • Provide alt text for images

Numbered List

If your items are a sequence or a series of steps, use a numbered list. A numbered list is important when there are specific steps the individual is to perform as part of a process. For instance, the following is a numbered list of steps to take to open a web page:

  1. Turn on the computer
  2. Login to your account
  3. Open the web browser
  4. Enter the address for the web page you want to visit.

Common List Mistakes

  • Creating lists manually using dashes and symbols and not using the list formatting tools
  • Creating a list for a single item. Lists should contain at least two or more list items. However, it is appropriate to use singular bullets when using list styles to organize outlines that contain main points and subpoints. 

Color Concept

Color and Accessibility

Color, like images, can add visual appeal to your web pages or documents and draw attention to important information. In order for color to work, however, it needs to be perceivable. Poor color choices can affect individuals who are visually impaired or color blind. 

Contrast 

Having sufficient contrast between the foreground text information and background color is necessary to be able to perceive the information. Text content that is not distinguishable from the background color can prevent not only individuals with visual impairments or low contrast sensitivity from reading the information, but also those trying to view content in sunlight or in glare conditions.

When choosing colors to present text information in web pages or electronic documents, the foreground to background contrast ratio should be a minimum of:

  • 4.5:1 for regular text
  • 3:1 for 18 point font and larger, or 14 point font and bold

In general, pastel colors or the “light” version of a particular color do not provide sufficient contrast against a white or dark background.

In the following example, the yellow welcome text is superimposed over a aqua colored background representing an ocean wave. The color and thin font used for the text makes it difficult to perceive the information.

Banner lacks sufficient contrast between text and background color.

Selecting a different font color as well as changing the background of the text can result in a more visually discernible welcome banner.

Banner text has contrast between text and background color.

The contrast ratio is evaluated by comparing the foreground and background color choices. A contrast ratio may be tested using the following tools:

Color & Meaning

Color should not be used as the sole means of providing information. Individuals who are blind, visually impaired, or have certain types of color-blindness may not be able to perceive what information is being communicated by color alone.

For example, the charts below show the reported reasons for inaccessible web page design. Without any additional information, it can be difficult to understand the categories.

However, with inclusion of additional information, along with the use of color, everyone can better understand how the information is organized on the pie chart. 

This inaccessible pie chart lacks labelled data and forces users to rely on interpreting the colors based on the legend. 

Pie chart that relies on colors to convey information.

This inaccessible pie chart uses greyscale, further reducing the contrast between the slices.

Pie chart greyscale.

This accessible pie chart provides detailed labels that include the data value and the category name on the chart in conjunction with a legend. 

Pie chart with labels and data values.
1 2 3 4