PowerPoint Accessibility
Microsoft PowerPoint includes options for adding accessibility information to slides to support access by individuals with disabilities. This information also ensures that Microsoft PowerPoint files maintain a level of accessibility when converted into other formats (e.g., tagged PDF). The best practices for Microsoft PowerPoint accessibility include:
- Structure
- Images
- Links
- Tables
- Accessibility Checker
- Exporting to Other Formats
Structure
In Microsoft PowerPoint presentations, the structure of the content can provide an organizational and navigational framework for individuals to understand the informational hierarchy and relationship between different sections of content. These structural elements can help determine the organization and logical reading order of the presentation for an individual using assistive technologies.
Slide Title
The Slide Title is used to provide a heading for the slide’s content. Slide titles should be unique and descriptive to help users navigate to specific content on the slides.
View and edit all titles quickly:
- Select View.
- Select Outline View.
- Edit the titles according.
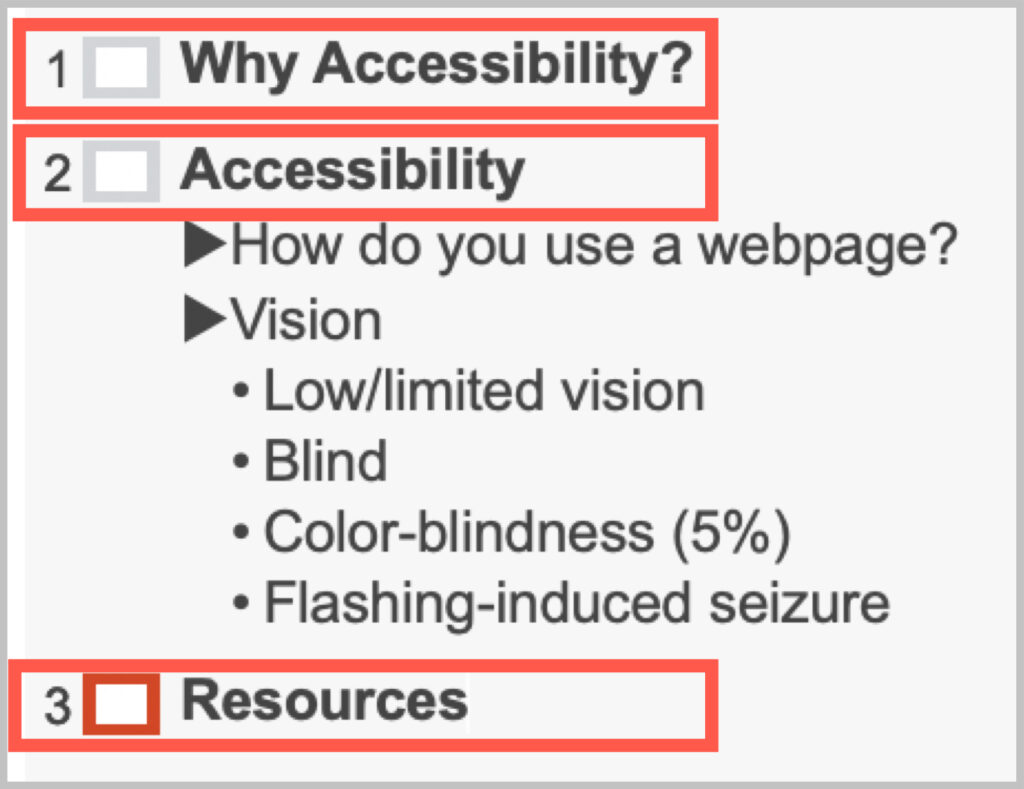
If slide titles that are the same, provide a numerical reference to differentiate the first slide from subsequent slides. For example, if there are two consecutive slides that cover the same topic, “Muscle Atrophy”, consider using “Muscle Atrophy 1” and “Muscle Atrophy 2”.
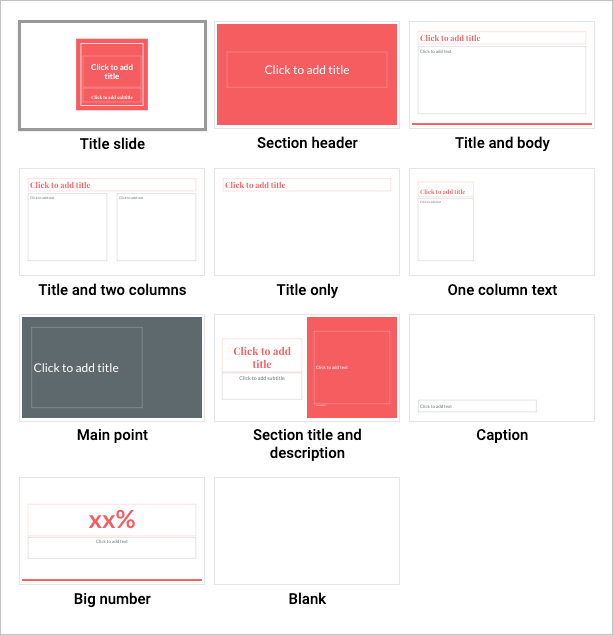
Slide Layout
Using preset slide layouts will automatically control the reading order and structure of content placed on the slide.
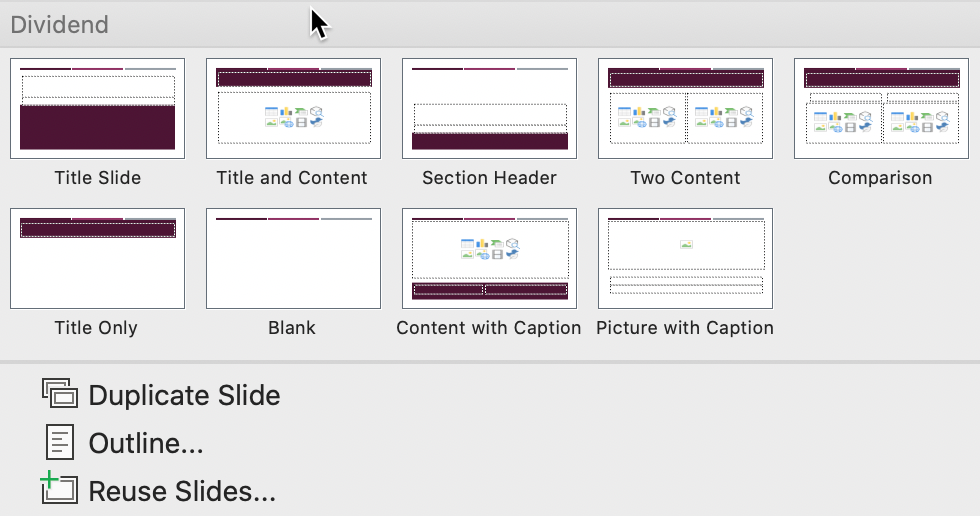
To choose a slide layout:
- To locate Slide Layout, select Home > select New Slide.
- Choose the slide layout that meets your needs.
For more information, read Microsoft’s support page Apply a slide layout.
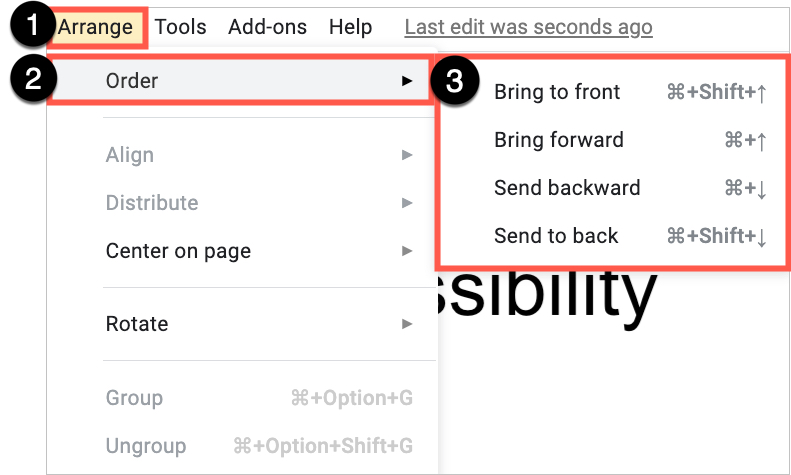
Managing Reading Order
If text boxes are separately created from the preset slide layouts, this information may not be in the correct reading order. If content is manually placed onto a blank slide, you will need to assess and manage the reading order using the Arrange button.
To review and fix reading order:
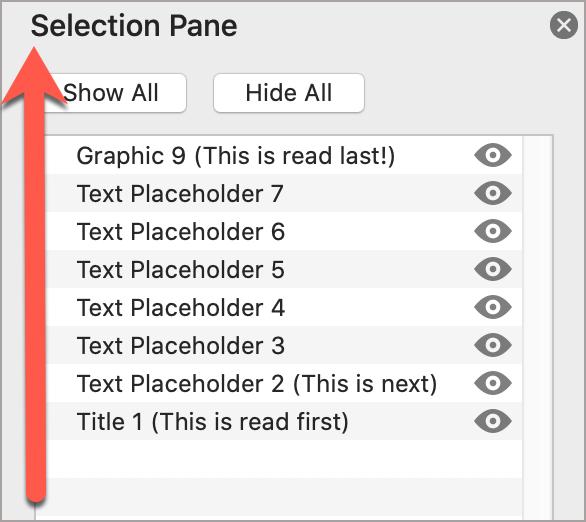
- Select Home > Arrange > Selection Pane
- Reading order begins at the bottom of the list. First highlight the “Title” and use the Up Arrow to view the reading order on the slide.
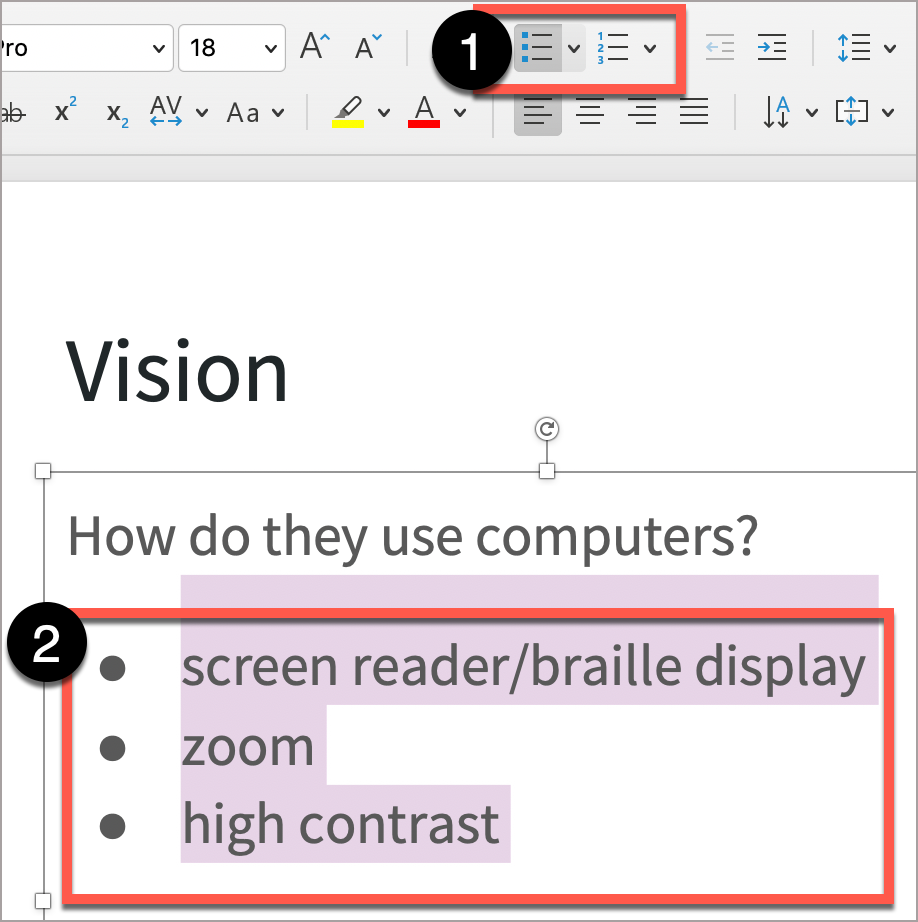
List
Use the built-in list styles to provide users additional guidance.
Do the grouped items convey a process or have a logical sequence? Use the number list style.
Is this grouped list of items in no particular order? Use the bullet list style.
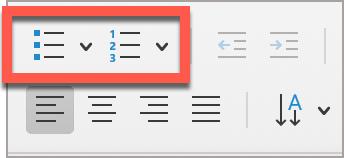
- Select Home.
- Select either the bullet or number list style.
Images
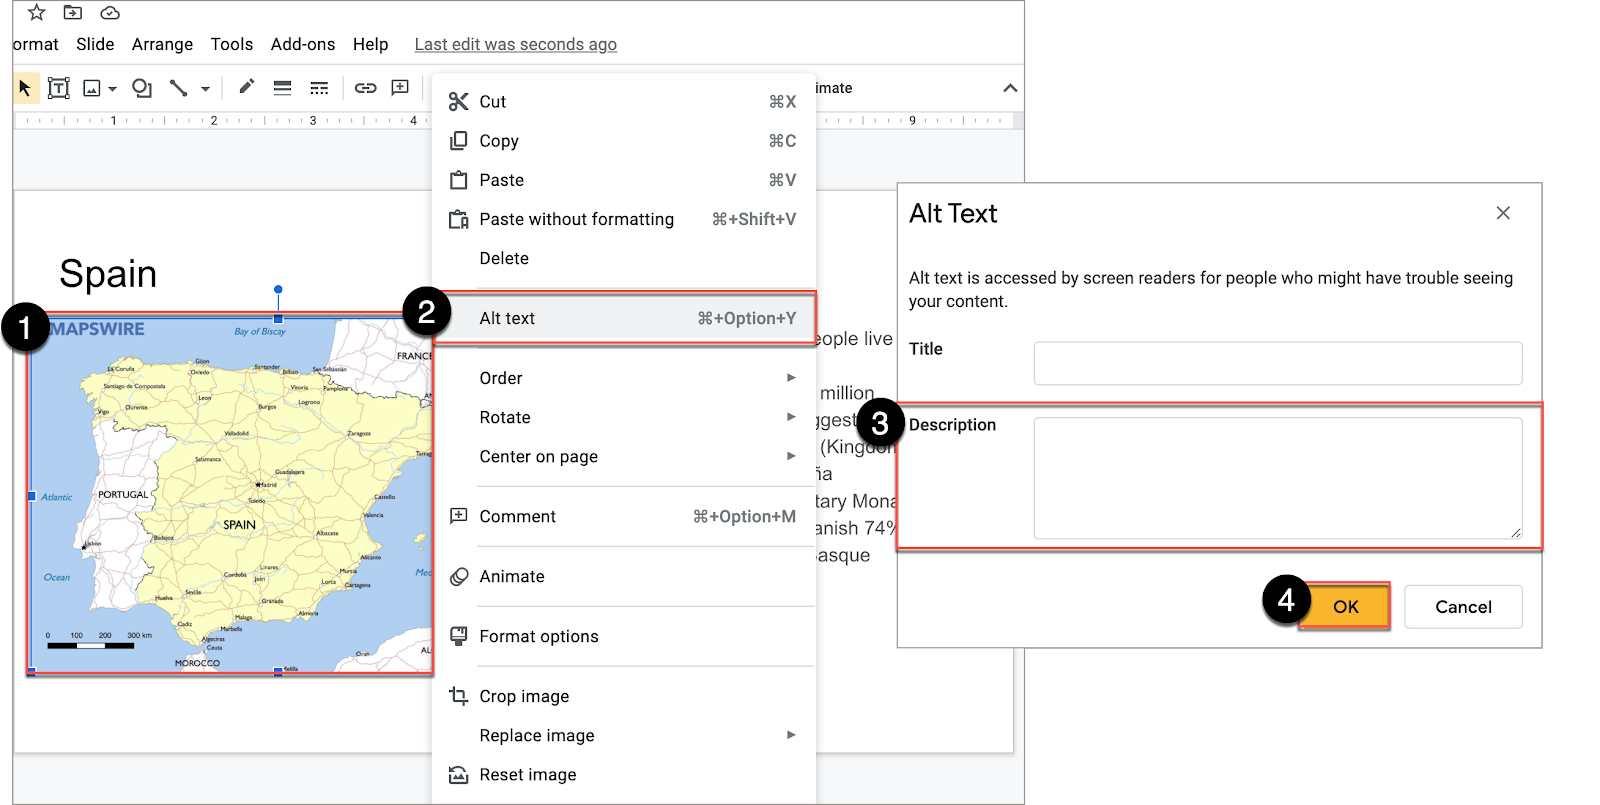
Images that support the content require a text description (also called “alternate text”) to communicate the purpose and/or content of the image. Image descriptions should be short and communicate the main purpose of the image. If a longer description of the image is necessary to fully explain its content, consider alternate strategies outlined on the Images page.
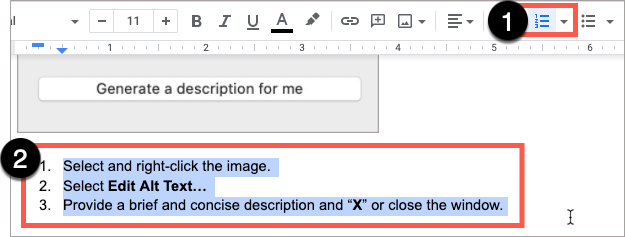
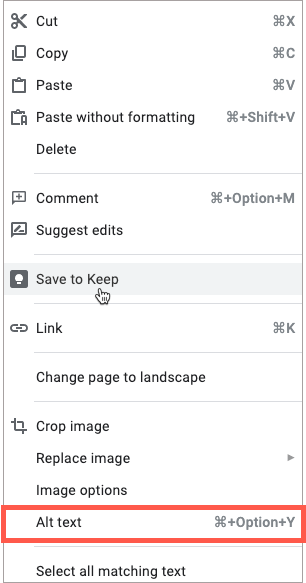
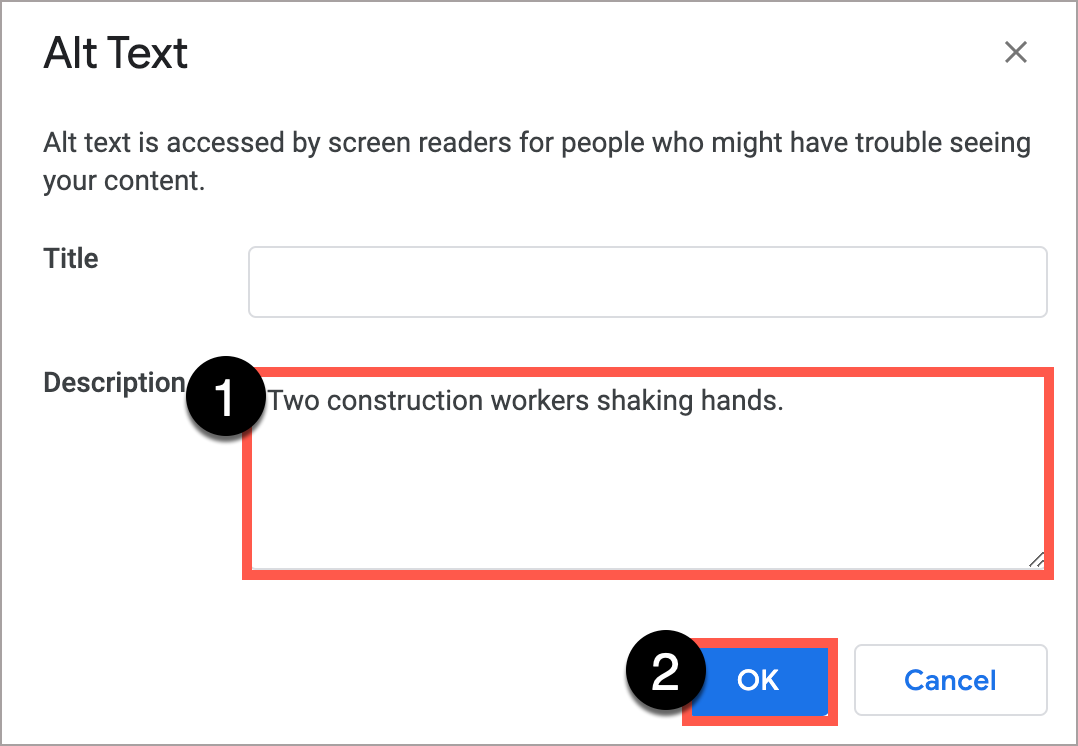
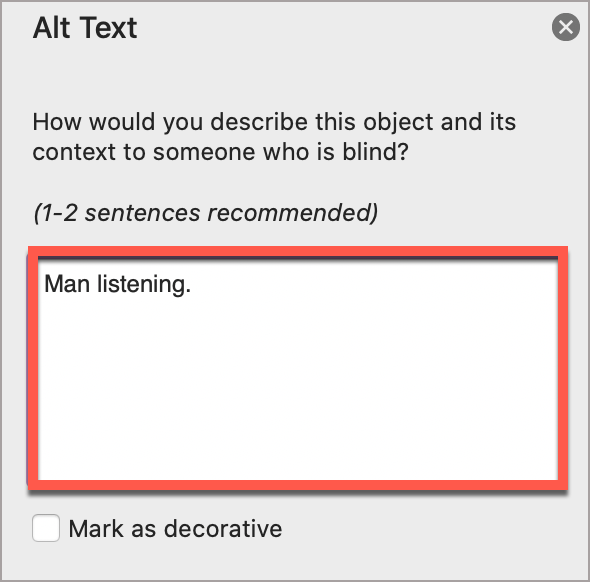
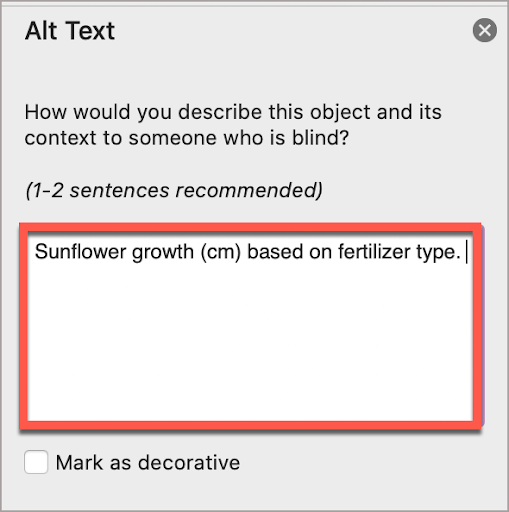
To add the alternate text:
- Right-click the image.
- Select Edit Alt Text…
- In the Alt Text window, write a descriptive text.
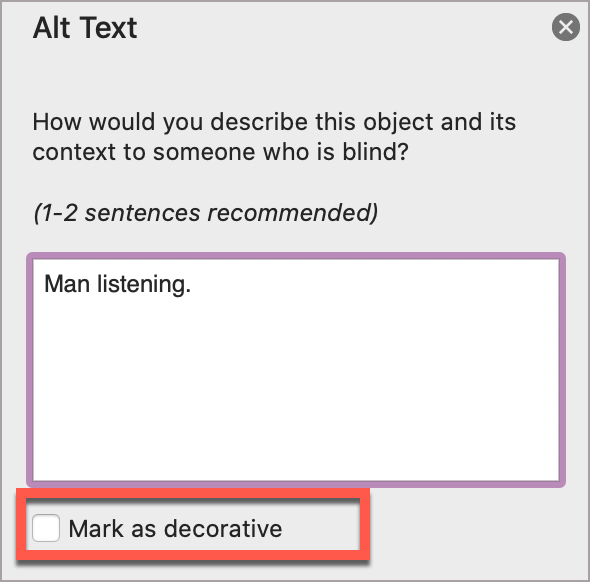
For images that are not supplementary to the content, consider using the check box Mark as decorative.
Important considerations
For additional guidance on writing effective text descriptions (i.e., alt text), please review the information on Images.
Formatting guidelines
- A text description should convey the purpose or content of the image in approximately 120 characters or less. Avoid repeating the same information as contained in the surrounding text.
- If the image is complex, consider providing additional information in the surrounding text of the document while providing a shortened text description.
- Do not include the file format in the alt text (Example: .JPEG, .PNG)
- Do not include “picture of” or “image of” in the alt text.
- For older versions of PowerPoint, leave the Title field bank, and only use the Description field for alt text.
Hyperlinks
Documents containing hyperlinks to websites or other online resources can be improved by including hyperlink text that is understood by the reader. For instance, using the full hyperlink URL may not make sense to the reader without some context.
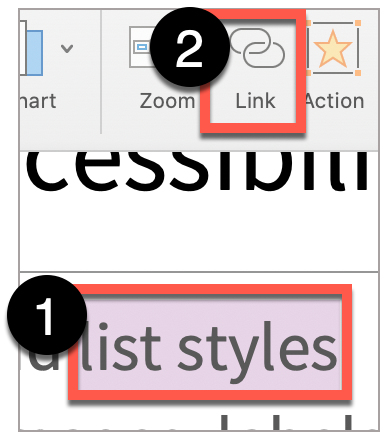
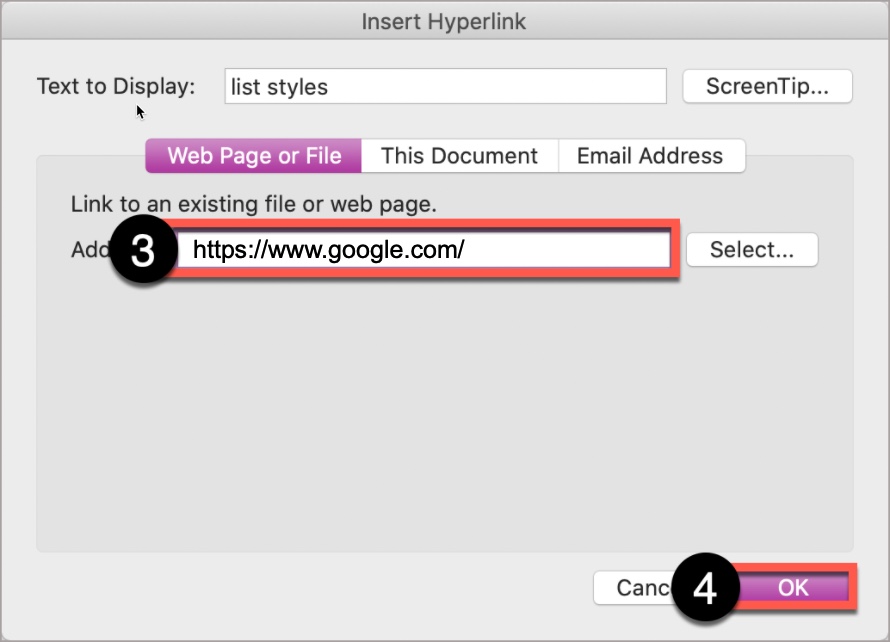
- Highlight the short descriptive phase or words that will become the descriptive hyperlink.
- Select the Link button in the menu.
- In the Address field, add the desired URL.
- Select OK.
For additional guidance, please refer to Links.
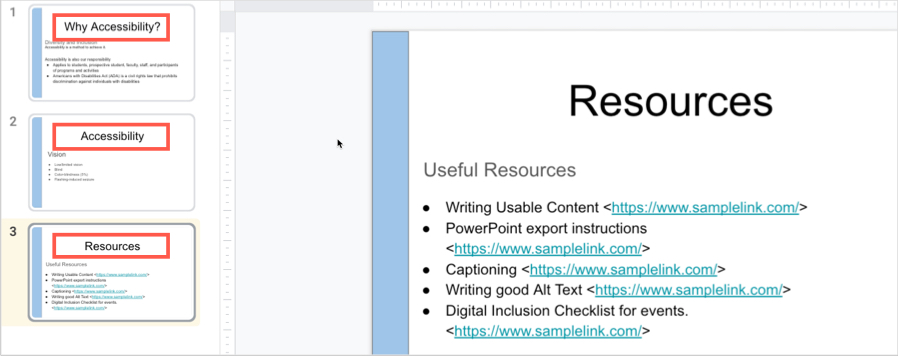
If the PowerPoint presentation is intended to also serve as a handout with resource hyperlinks, content authors may want to create a reference slide at the end that lists the full URL of the hyperlink.

Tables
When possible, use a simple table structure for tabular data. Using tables with split cells, merged cells, or nested tables can lead to issues with assistive technologies recognizing the appropriate column and row header information in a data table.
Avoid using a table to manage layout. Instead, use a Slide Layout that orients content into the appropriate visual layout as desired.
Tables should include the following:
- At least one header (the row and/or column).
- Alt Text description summarizing the table
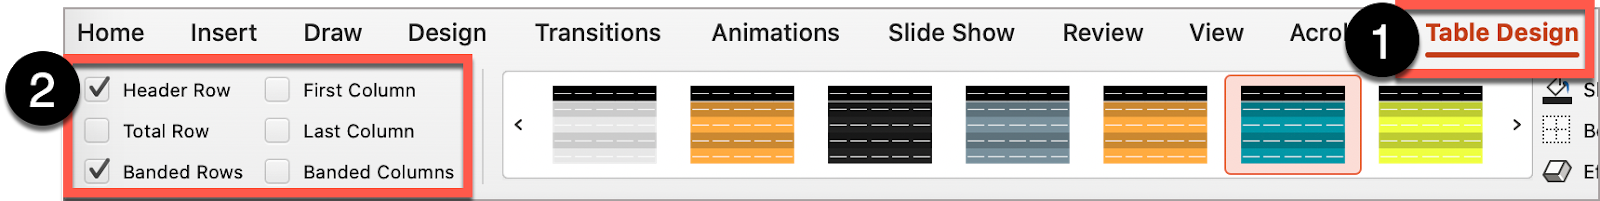
Specify the Header
To mark a header row for a data table:
- Select the table to reveal Table Design. (Note: this tab will only appear if the table is selected.)
- In the far left-hand section, determine the required header type:
- Header row: check the box Header Row.
- Column header: check the box First Column.
Add Alt Text
- Right-click on any of the white perimeter squares.
- Select Edit Alt text…
- Write descriptive Alt Text in the Alt Text field.
For additional guidance, please read Complex Graphs and Layouts.
Color
Color can be an effective method to communicate ideas and draw attention to information. Insufficient color and contrast can limit the ability of others to perceive and understand the presentation.
PowerPoint offers a variety of slide themes, but not all of these will provide sufficient contrast. To edit Slide Theme colors:
- Select Design > expand the Color Palette Menu to reveal available color combinations.
- Select Colors to review the pre-built color palettes or select Customize Colors…to create a slides that have appropriate color contrast.
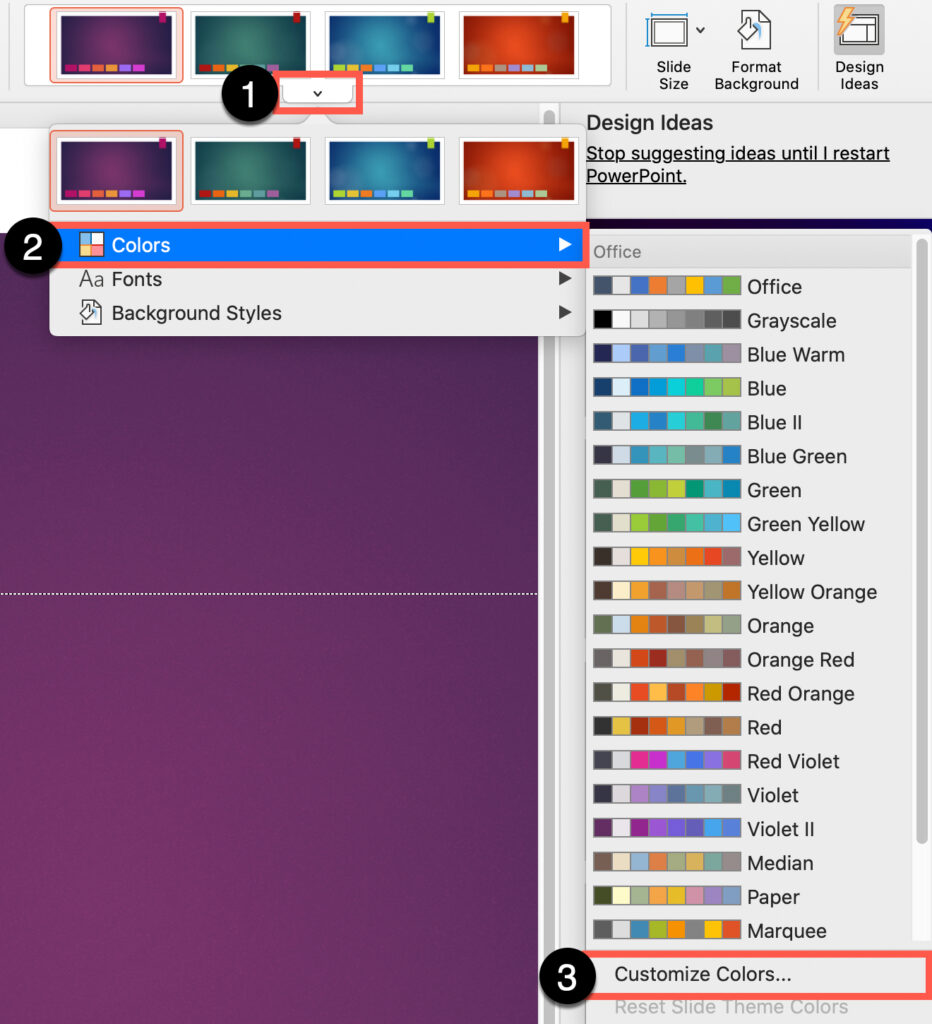
Select one with accessible contrast, or select Customize Colors… to manually select the colors. Alternatively, you can use other methods in Microsoft PowerPoint to remove or change the current theme in your presentation.
Accessibility Checker
Evaluate your PowerPoint accessibility using the Accessibility Checker. Please read Microsoft’s support to learn how to improve accessibility with the Accessibility Checker.
Errors, Warnings, and Tips
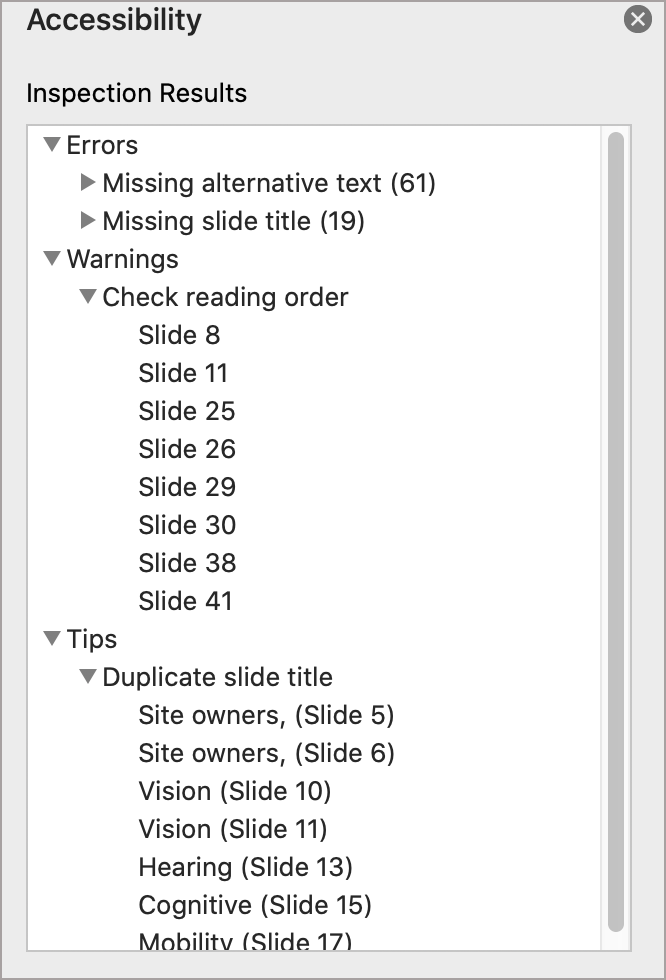
The Accessibility Checker presents the results in a pane on the right-hand side of the interface. It organizes the results into three categories: Errors, Warnings, and Tips.
- Errors – Must Fix
Errors are issues which indicate content that contains an accessibility issue and is extremely challenging, if not impossible, to read or understand.
Note the following cannot be completely resolved – these results will continuously appear:
- Warnings – Most Likely Will Need to Address
Warnings indicate that the content may be challenging for individuals with disabilities to read or understand. Resolving some Warning may require the author to consider a different visual or organizational layout.
- Tips – Very Helpful
Tips are pointers intended to help you improve the user experience of your audience by streamlining and organizing your content in certain ways. Tips provide additional guidance and will appear depending on the content.
The Accessibility Checker is a good starting point towards identifying potential accessibility issues in a document. Microsoft continually updates the Accessibility Checker rules and so newer versions of Microsoft products may result in a different list of accessibility results. Using the Accessibility Checker can help identify some of the more significant accessibility issues present in a document.
To check accessibility:
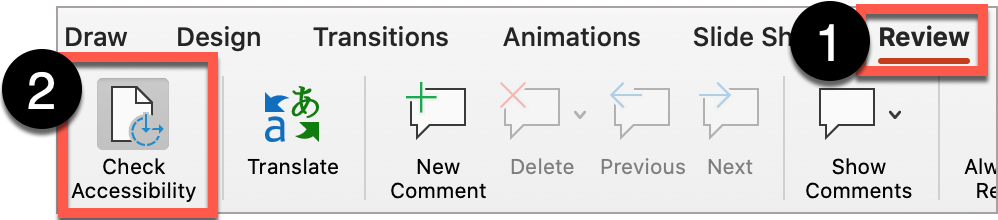
- Select Review.
- Select Check Accessibility.
Exporting to Other Formats
Important
Never choose a “Print” to PDF option in Office, or in any other program. A screen reader user may still be able to access the text of a PDF created in this way, but heading structure, alternative text, and any other tag structure will be lost.
Creating a PDF
Mac
Create PDF with PowerPoint using “Save As”
Users of PowerPoint for Mac should be cautioned that exporting to PDF will not yield an accessible, tagged PDF document, it must be remediated using Acrobat Pro.
Create PDF with Acrobat
- Use the Acrobat plug-in in the ribbon. Select the Acrobat tab.
- Select Create PDF.
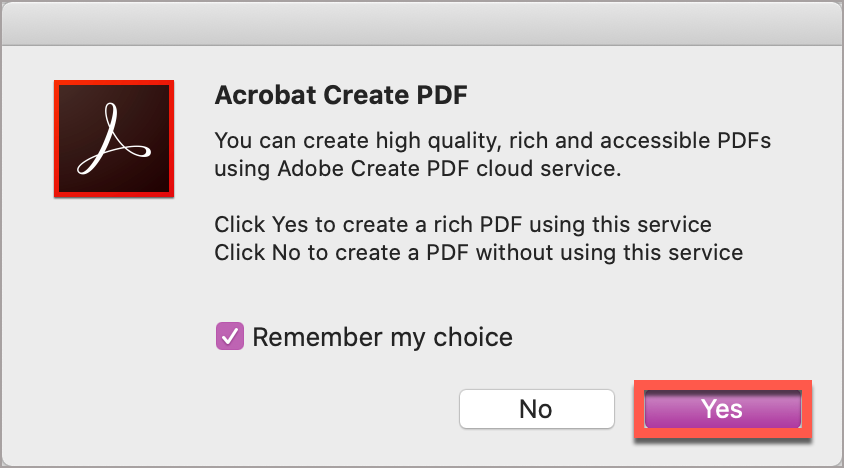
- Adobe Acrobat will automatically open and present your content in PDF format.
Windows
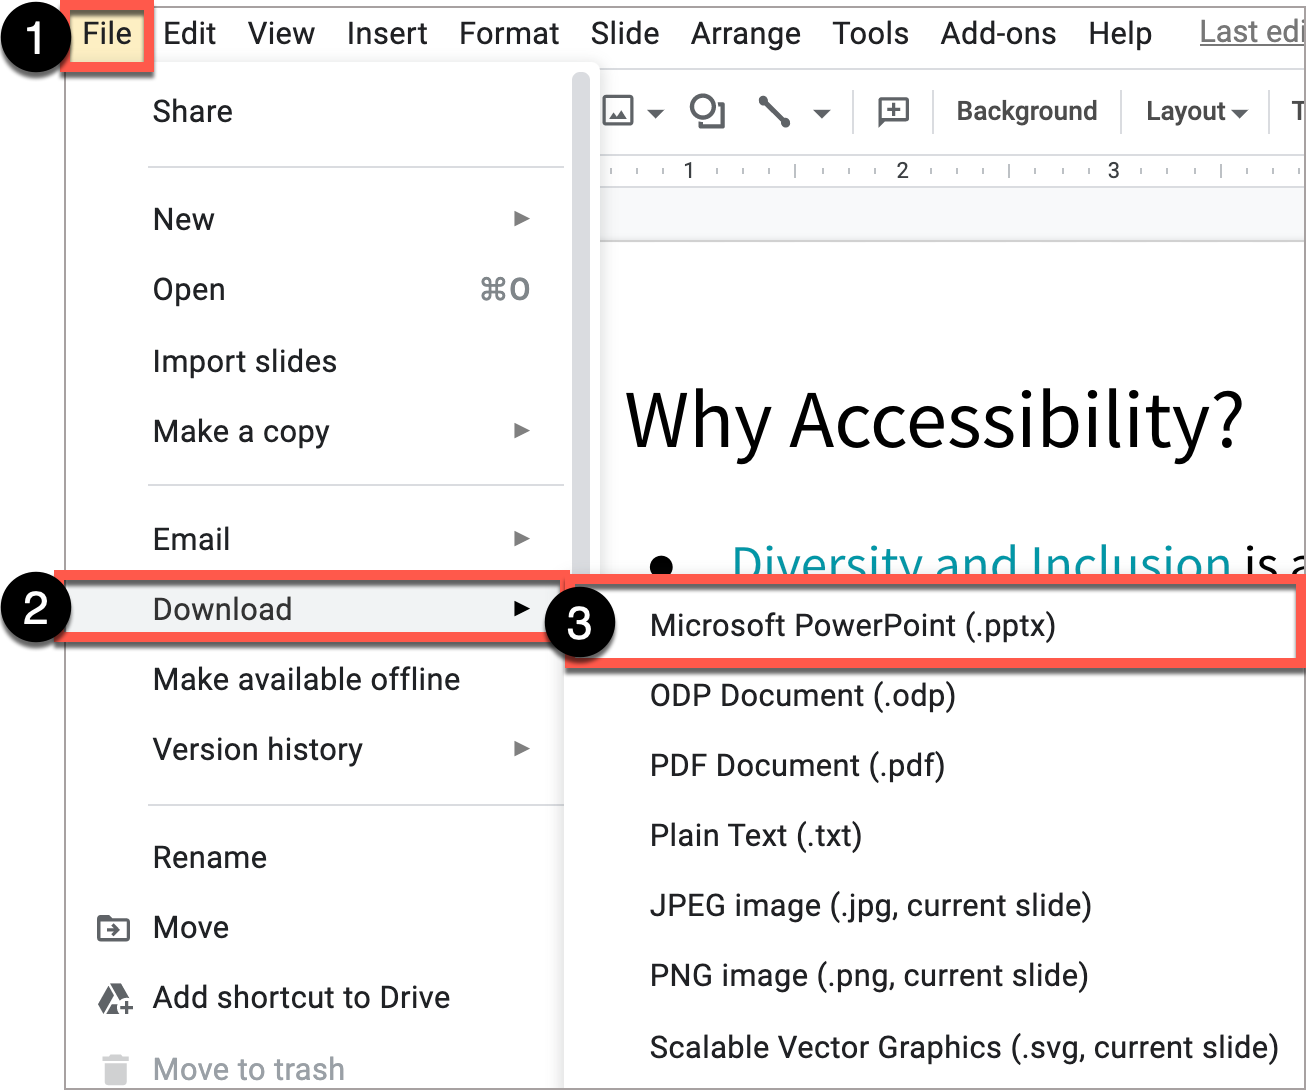
Create PDF with PowerPoint using “Save As”
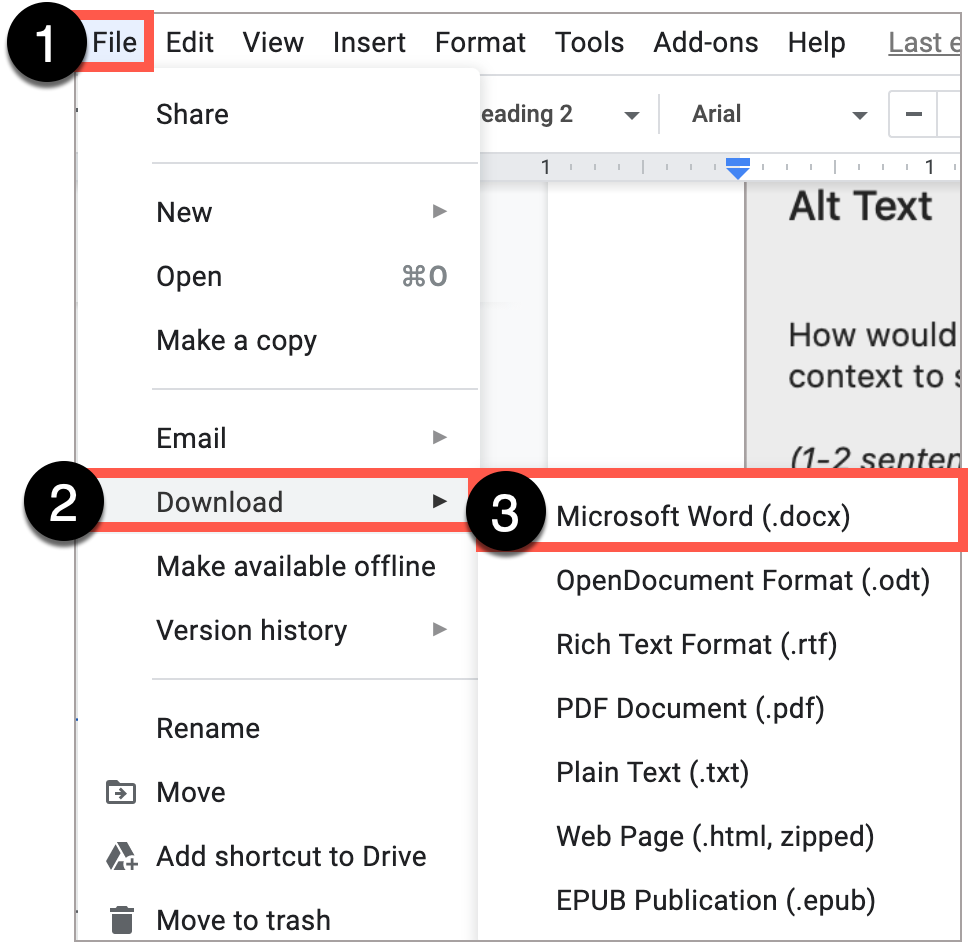
- Select File > Save As
- Select PDF > More options…
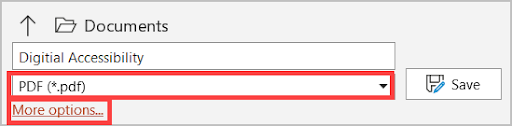
Alt Text: In the Windows version of PowerPoint, select file, then Save As. Choose PDF from the file format menu, then More Options. - In the Save As dialog, select Options.
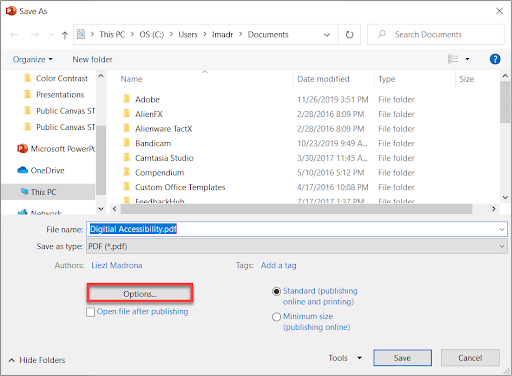
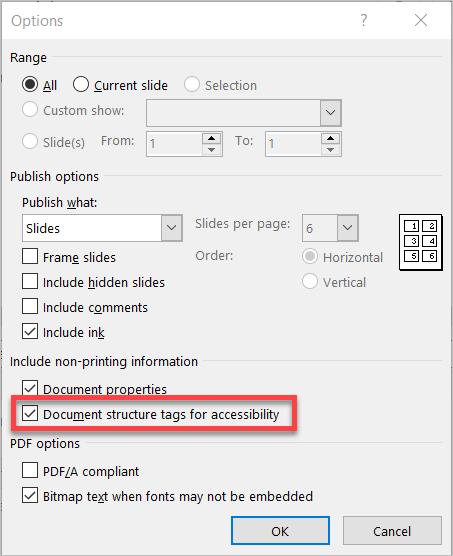
- Verify in Options dialog that Document structure tags for accessibility is selected. Select OK.
Create PDF with Acrobat
- Use the Acrobat plug-in in the ribbon. Select the Acrobat tab.
- Select Create PDF.
Windows
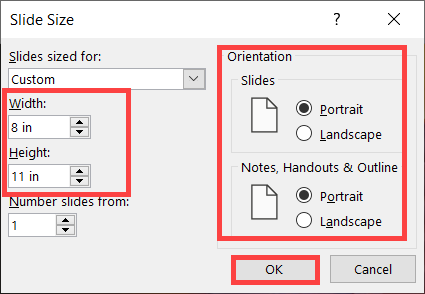
- Specify your flyer dimensions via the Design tab, select Slide Size > Custom Slide Size…
- Determine the Width and Height in inches & select OK.
Standard paper size:- Width: 8 in
- Height 11 in
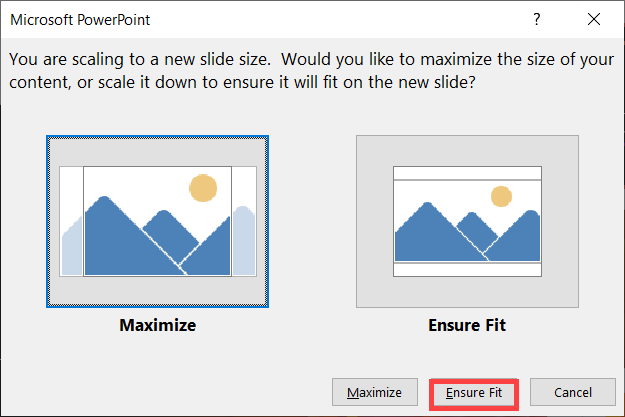
The Microsoft Powerpoint dialog will appear. Select Ensure Fit to avoid cropping out content from the slide size frame.
- Select Arrange to manage reading order. Apply accessibility principles such as alt text, descriptive hyperlinks,
Creating a Lecture Video of Your PPT presentation
Here are some guidelines for creating and posting PowerPoint lecture presentations.
- Create a transcript to read from or prepare an outline of points to help you create concise videos.
An audio recording needs a transcript to allow individuals who are deaf or hard of hearing to access your content.
The transcript is a text equivalent of the audio recording and should include not only the spoken information, but also identify any speakers or other sound effects as part of the recording. A transcript may be useful in its own right as a learning tool for students, who can read the text and search for keywords.
- When screencasting, provide a brief description of on-screen content and actions. This provides concept reinforcement and allows students to easily follow along whether they rely on listening or prefer to listen to just the audio to study. Read more about audio description.
- Provide your students an accessible version of your presentation and transcript (if available).